
Given the rise of collaboration analytics in the last few years, it was only a matter of time until Microsoft announced powerful built-in analytics capabilities for Teams. Not only have we seen leapfrog advancements in analytics technology (less resource-intensive, drill-down features, easy to understand), but there is also a clear demand from users to analyse changing collaboration patterns in the new normal.
Specifically, in response to the COVID-19 pandemic in 2020, Microsoft introduced a completely revamped analytics capability as part of the Teams platform. This release, combined with Teams’ existing analytics tools, are beneficial for users in every role. Whether you are a collaborator or a frontline employee, a team manager or an IT administrator, Microsoft Teams analytics reveals valuable insights to help make smarter decisions in a WFH environment.
Where Does Analytics Reside in Microsoft Teams?
There are three ways to access analytics insights on Teams, and each has a specific purpose.
Analytics & reports in the Teams admin centre
If you are an IT administrator or have admin access to the Teams system, the analytics & reports module tells you all about the technical aspects of Teams usage, adoption level, resource utilisation, device patterns, and lots more. Simply open the Teams Admin Centre and click on the Analytics & reports tab on your left pane.
A dashboard opens that can help you generate reports on various Microsoft Teams metrics. These cover Teams usage, live events, device-specific trends, PSTN usage, and blocked calls.
How can you leverage this built-in analytics capability in a WFH environment?
To begin with, the Teams usage report depicts usage trends over time, mapped across the entire WFH duration. If you initiated WFH collaboration training just after switching to remote work, the analytics would reflect how effective this training really was, and if usage numbers have improved. You will also learn which teams have the highest numbers of active users – if a specific department has low usage despite employing a large number of workers, it could signal the need for training intervention.
Device usage is also important as it tells you how many people are increasingly reliant on their smartphones, and if you should start preparing for BYOD once you resume in-office operations.
The other analytics reports deal with PSTN trends. How many minutes were consumed and how much is available? How seamless is the connectivity via Calling Plans and Direct Routing? Microsoft Teams analytics are particularly helpful for identifying gaps in cloud connectivity that could be causing Direct Routing call drops. There will also be numbers indicating minutes used against minutes available.
During WFH, employees will turn to telephonic conversations far more often than an in-office environment. For contact centres, Teams could be the primary channel for carrying out business activities. Teams built-in analytics helps monitor performance, ensure systems are functional and anticipate capacity requirements to buy more minutes.
Analytics across all or specific teams
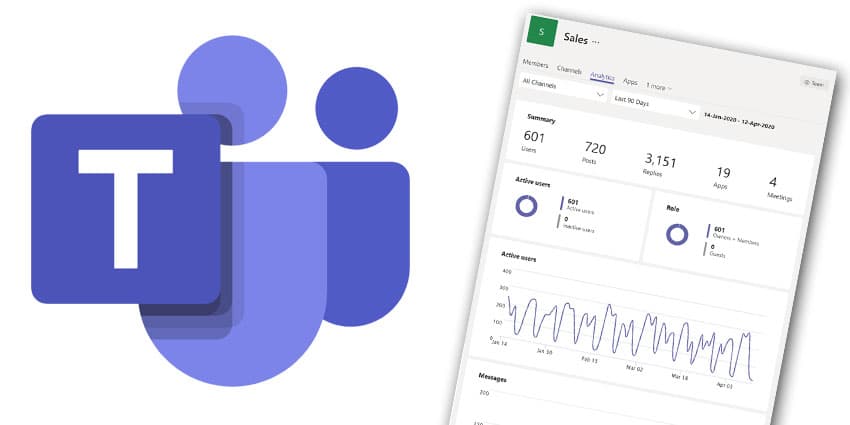
If you are a member or an owner of specific teams, the platform will show analytics numbers for these groups as well. From the left panel on the Microsoft Teams UI, click on the Teams tab – at the very bottom, just beside the “Join or create a team” option, there will be a Manage Teams button.
From the top of the page that opens, you will be able to view team-wise analytics. The dashboard lists the number of total people, guests, posts, and active users for the teams to which you belong and own over a specific date range.