

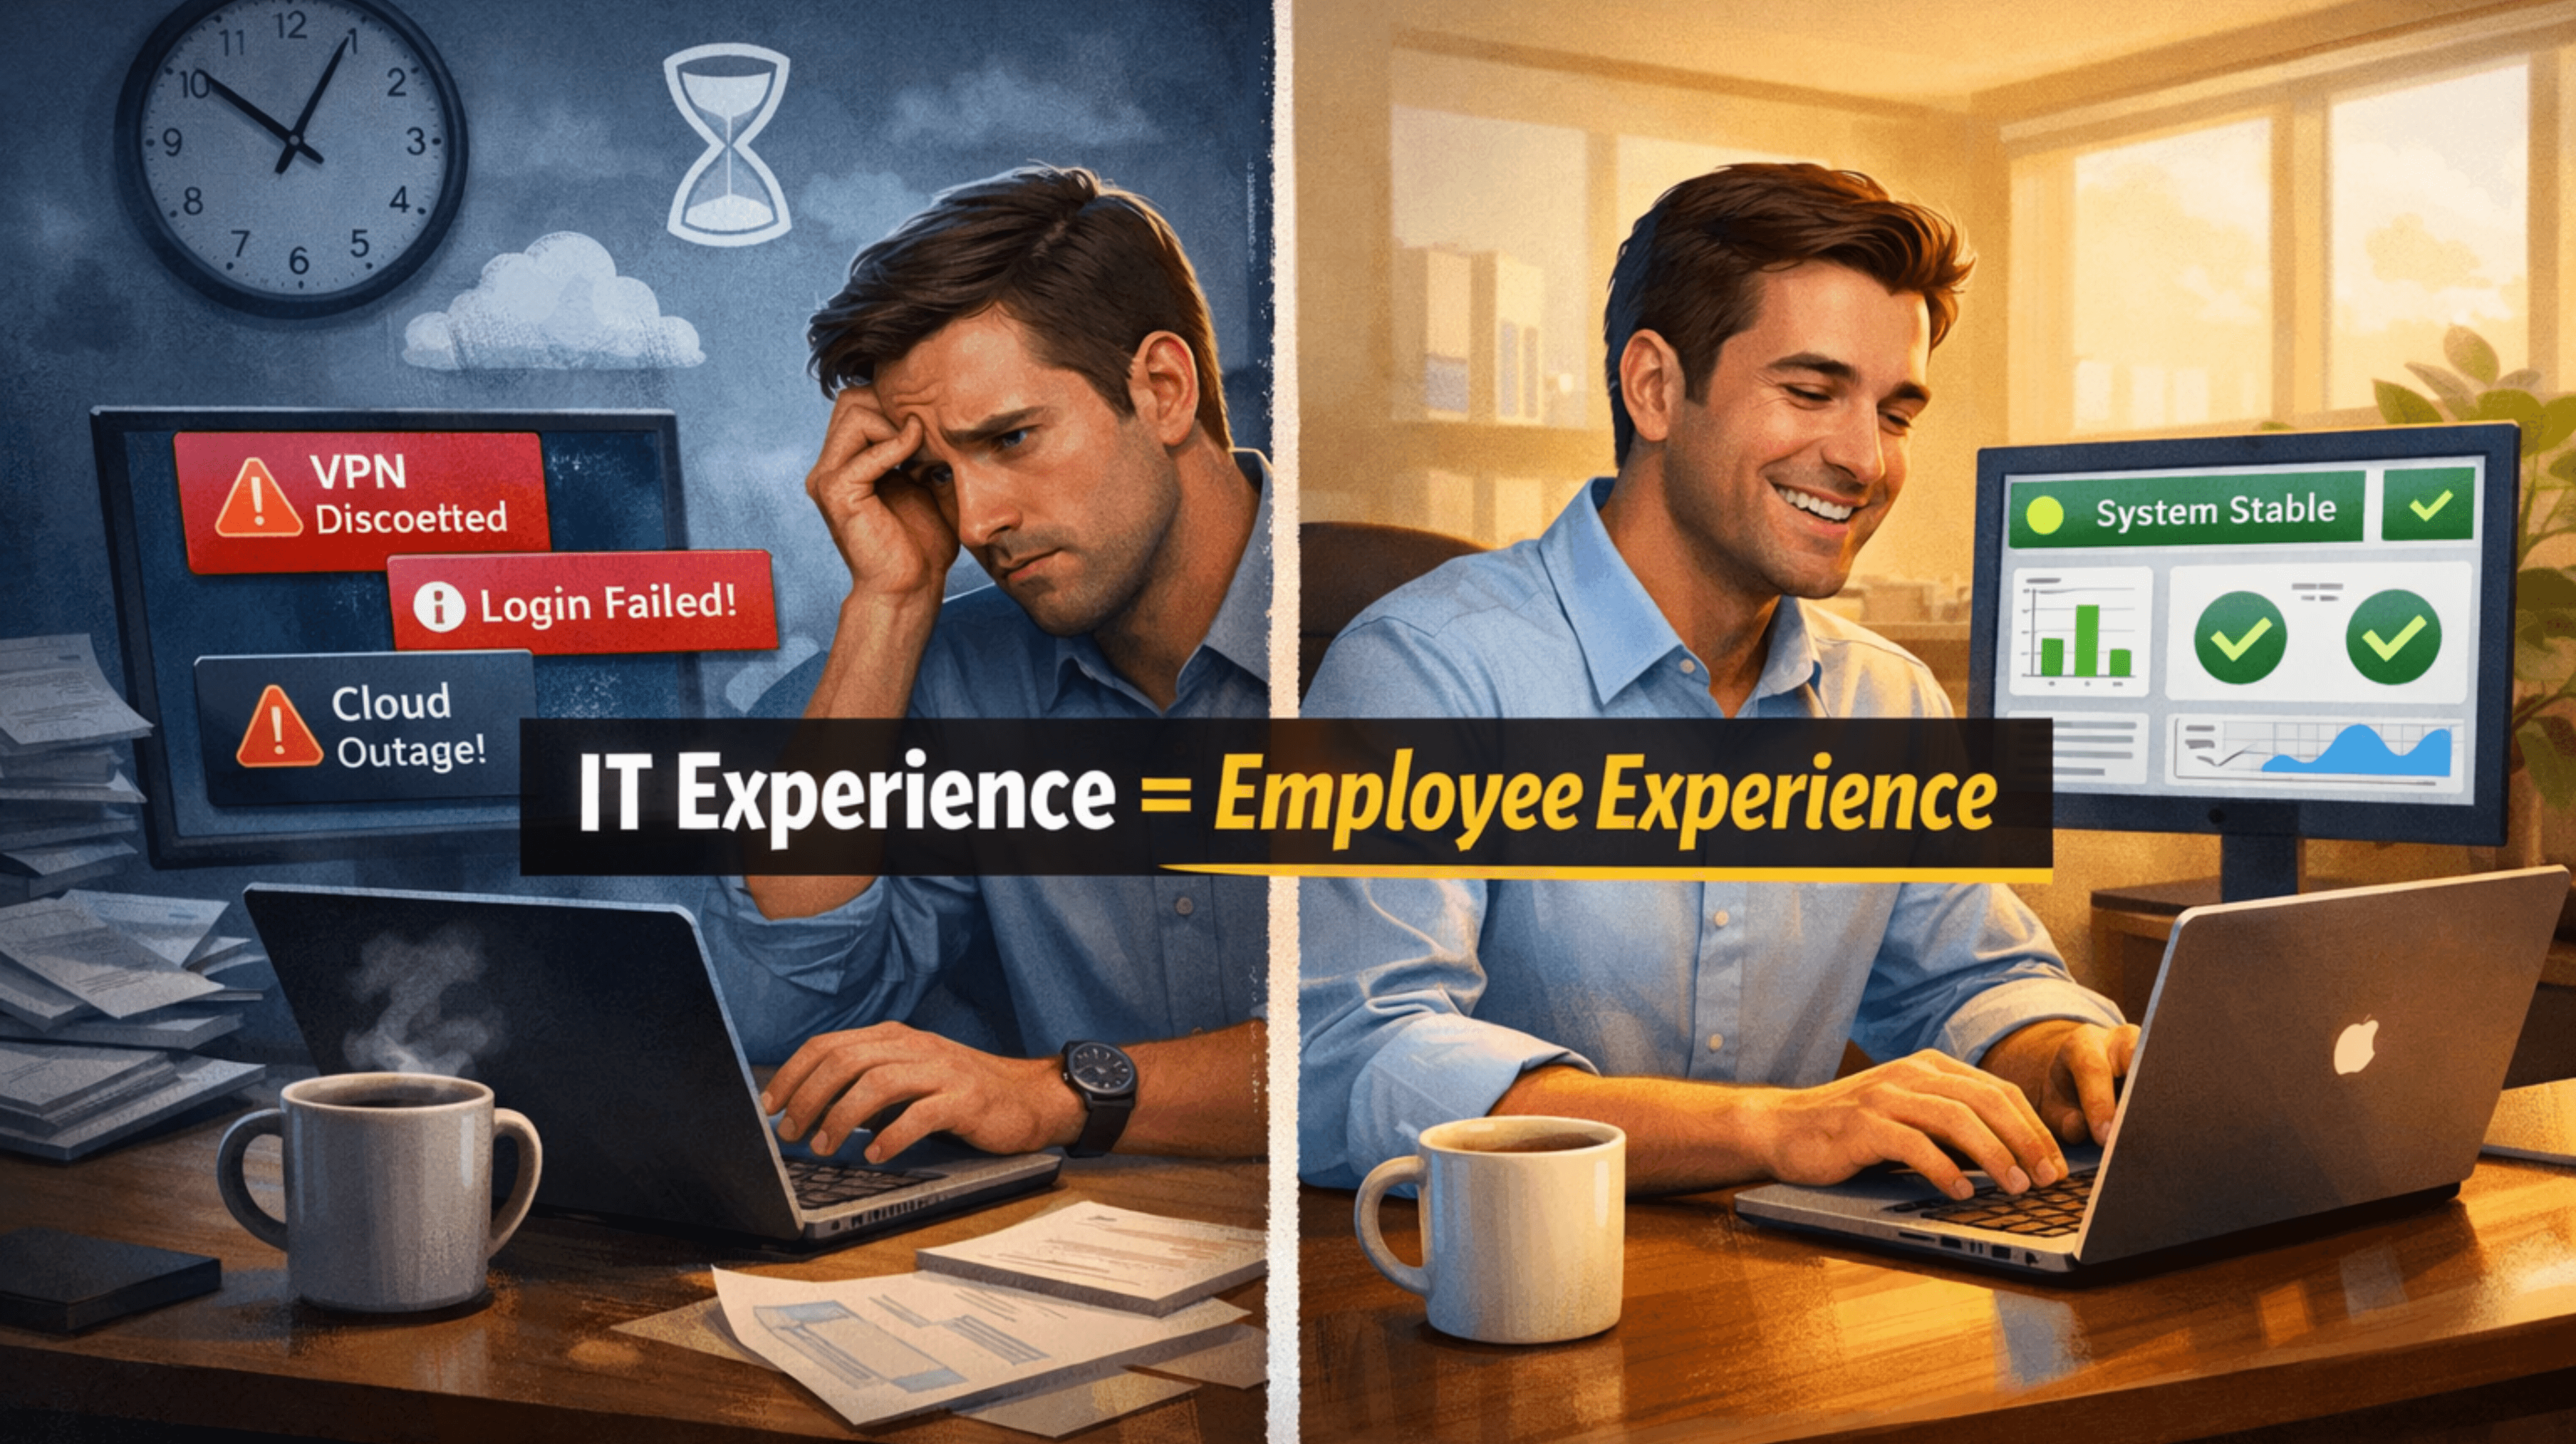
Week after week, plenty of people lose half of their morning to tech issues. Sometimes, the problem is something no one can easily fix (like all the cloud outages at the end of 2025). Most of the time, though, they’re issues that get dumped onto the IT team.
It’s frustrating for everyone, your IT staff, and the employees who have to sit around twiddling their fingers because they can’t get anything done. That’s why IT has a closer relationship with employee experience than most companies realize. It’s also why businesses trying to improve EX should be paying more attention to IT experience metrics, so they can fix issues before they snowball.
Service desks and IT teams aren’t cost centers anymore; they’re the people keeping things running. Keep in mind, 74% of employees say even a minor technical hiccup can derail their day.
That stat doesn’t surprise anyone who’s actually watching how work gets done. What surprises leaders is how fast those moments add up, and how clearly they show up in IT experience metrics long before engagement scores plummet.
Further reading:
- Why XLAs are Replacing SLAs in UC
- Net EX Score: The New Playbook for Measuring EX
- Can Employee Experience Data Become a Measurable Business KPI?
What Are IT Experience Metrics?
IT experience metrics are the KPIs that examine how users (employees) feel when they're interacting with software, apps, or tools.
The convergence of “IT experience management” and “employee experience management” didn’t happen because IT suddenly got more strategic. It happened because work got messier.
Hybrid schedules cracked open the day. Tool sprawl filled the gaps. Notifications became the background noise of everything. Most employees now experience the organization through workflows, and workflows are tech. When those workflows snag, stall, or send people in circles, the organization feels sloppy.
That’s why IT experience metrics punch above their weight. They capture things traditional engagement data might miss, like:
- How often work gets interrupted
- How long it actually takes to regain focus
- Whether people trust the fix will hold
- How much effort it takes just to get help
This is where ITXM EX starts to feel different from the old IT scorecards. It isn’t another satisfaction number to glance at and forget. It explains why outcomes move, and how safe it feels to rely on the systems you need to do your job.
A few companies benchmarked just how significant the impact of IT can be on employees. For instance, one survey found 13% of tickets drive 80% of perceived productivity loss. That also proves that most EX damage doesn’t come from catastrophic outages. It comes from a small cluster of recurring, irritating issues that never quite get fixed.
Which Metrics Reveal Recurring Digital Workplace Issues?
IT teams are just like customer support teams. They’ve got tons of data; they just struggle to convert it into something meaningful. The last thing you want to do is overwhelm them with more signals to track, but it can help to give them an iron-clad idea of what they should be sharing with the leaders responsible for actually improving employee experience.
Experience Signals (What People Feel)
These are the fastest indicators of whether digital employee support actually helps team members make the most out of their day. They don’t really need huge surveys, just little nudges asking people how things work, a lot like the little “did we help today?” nudges you see in CX.
- Post-interaction sentiment: How did this feel, honestly?
- Confidence after resolution: Will I see this again next week?
- Effort-to-get-help score: number of steps, handoffs, and “try this” loops
- Communication clarity: whether updates were useful or just noise
Example: Two tickets close in ten minutes. One employee feels reassured. The other screenshots a workaround “just in case.” Same SLA. Completely different IT employee experience.
Friction Signals (What Work Actually Costs)
This is where DEX data and IT experience metrics start to matter emotionally. A lot of the service desk and workplace management tools companies have access to today can track things like:
- Lost time per employee from tech interruptions
- Time-to-productivity restored (how long before real work resumes)
- Focus recovery time after incidents or outages
A slow VPN at 9 a.m. doesn’t just steal ten minutes. It wrecks the first hour of the day. That shows up in experience data pretty quickly if you know where to look.
Reliability & Recurrence Signals (What Keeps Breaking)
Employees expect things to break sometimes (we all do), but it gets a lot more frustrating when they’re dealing with the same problems again and again. Watch out for:
- Repeat incidents by app, device, or service
- Reopened tickets and “fixed but not really” patterns
- Change failure impact: updates that technically succeed but land badly
When these IT experience metrics show up, it’s not a verdict on whether IT is doing a good or bad job. Most of the time, they’re exposing a mismatch. The tools technically function, but they don’t match how employees actually work day to day.
Journey Signals (Where EX Cracks at Key Moments)
Some moments within the employee experience are more impactful than others:
- Onboarding access delays, provisioning gaps, and identity issues
- Role changes, manager transitions, tool migrations
- M&A or reorg moments where systems lag behind reality
- Tech problems when new tools are introduced
The important part is spotting which people are getting hit hardest when things go wrong. Once you see that, you stop guessing and start putting support where it actually helps, instead of spreading it evenly and hoping it sticks.
Inclusion Signals (Who Feels It Most)
Averages can hide issues with digital inclusion that a lot of companies overlook. You might not realize that the reasons your hybrid teams are complaining more often is that they don’t get the same amount of support as in-office staff.
Or you might overlook the fact that your senior employees are doing better with AI tools because they’ve got more training. Segment every signal by location, role type, and even specific employee needs. That’ll give you a clearer idea of whether everyone’s getting the same level of assistance.
Unsure if your workplace is really inclusive? Find out with our guide to digital inclusion in hybrid work.
What Practical Fixes Improve IT Experience Before Problems Escalate?
Gathering all the right data is helpful; putting it to use is where you start to see the real benefits. Once you’re using all of your tools and tech to capture insights across the employee IT stack, you need to figure out what to do next. Here’s how to begin.
Step 1: Start Where Experience is Most Expensive
You’ll almost always spot a few metrics waving their arms, telling you something’s broken. The instinct is to chase the loudest issues, the ones with the most tickets attached.
That’s not always smart. Maybe email causes regular headaches, but if your teams live in a collaboration platform all day, fixing friction there might matter a lot more. Go after the problems that burn the most human time, not the ones that inflate your ticket count.
Step 2: Combine Telemetry and Sentiment to Find Root-Cause Friction
This is where DEX and ITXM EX actually meet. Telemetry tells you what’s broken: crashes, latency, login failures, and device health. Experience data tells you how damaging it feels: effort, lost time, and confidence. Put them together, and patterns get obvious fast.